3.4.1. Beispiel Orthogonalisierungsverfahren#
nach Erhard Schmidt
import numpy as np
from sympy import symbols, integrate, lambdify
import matplotlib.pyplot as plt
from IPython.display import Math, display
Der Raum der quadratisch integrierbaren (nach Lebesgues) Funktionen \(L_2[-1,1]\) ist mit dem Skalarprodukt
und der induzierten Norm
ein Hilbertraum. Wir definieren daher das Skalarprodukt (dot-product) und die norm wie folgt:
t = symbols('t')
def dot(x,y):
    return integrate(x*y,(t,-1,1))
def norm(x):
    return dot(x,x)**(1/2)
Wir betrachten die Folge \(\{t^n\}_{n\in\mathbb{N}}\subset L^2[-1,1]\) von Monomen:
yi = [t**i for i in range(5)]
yi
[1, t, t**2, t**3, t**4]
Die Monome sind nicht orthogonal, jedoch linear unabhängig. Falls dem so wäre müsste eine Diagonalmatrix entstehen:
m = [[dot(yi[i],yi[j]) for j in range(5)] for i in range(5)]
m
[[2, 0, 2/3, 0, 2/5],
 [0, 2/3, 0, 2/5, 0],
 [2/3, 0, 2/5, 0, 2/7],
 [0, 2/5, 0, 2/7, 0],
 [2/5, 0, 2/7, 0, 2/9]]
Wir berechnen nun ein orthonormales System, basierend auf den Monomen nach dem Verfahren von Schmidt:
xi = [yi[0]/norm(yi[0])]
for i in range(1,5):
    zi=yi[i]-np.sum([dot(yi[i],xi[j])*xi[j] for j in range(i)])
    xi.append(zi/norm(zi))
Das Orthonormalsystem ist damit gegeben durch:
for xii in xi:
    display(xii)
Test des Orthonormalsystems ergibt die Einheitsmatrix:
m = [[dot(xi[i],xi[j]) for j in range(5)] for i in range(5)]
np.round(np.array(m,dtype=float),8)
array([[ 1.,  0.,  0.,  0., -0.],
       [ 0.,  1.,  0.,  0.,  0.],
       [ 0.,  0.,  1.,  0.,  0.],
       [ 0.,  0.,  0.,  1.,  0.],
       [-0.,  0.,  0.,  0.,  1.]])
tp = np.linspace(-1,1,400)
n = 0
plt.plot(tp,xi[0]*np.ones_like(tp),label='$P_'+str(n)+'(t)$')
for xii in xi[1:]:
    n += 1
    f = lambdify(t,xii,'numpy')
    plt.plot(tp, f(tp),label='$P_'+str(n)+'(t)$')
plt.grid()
plt.legend()
plt.show()

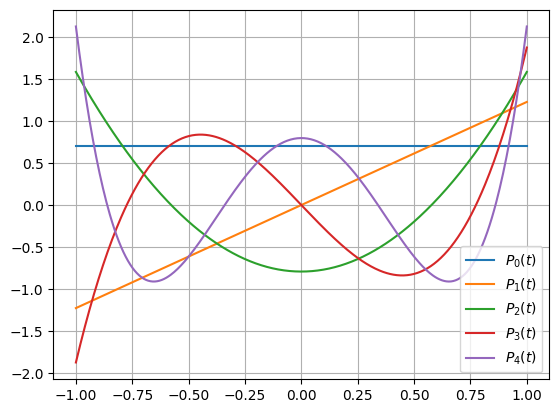
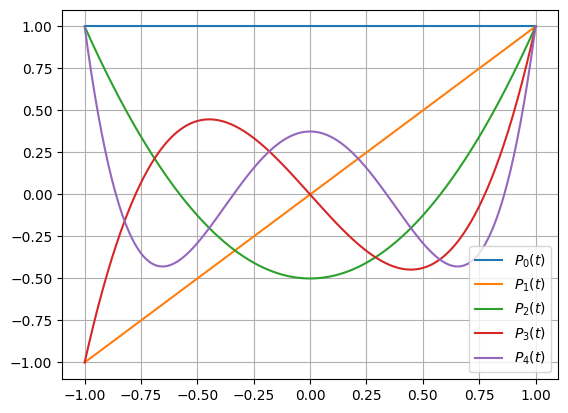
Das Resultat sind bezüglich der \(L_2\)-Norm normierte Legendre’sche Polynome. Üblicher weise werden die Polynome mit \(P_n(1) = 1\) normiert:
tp = np.linspace(-1,1,400)
n = 0
plt.plot(tp,np.ones_like(tp),label='$P_'+str(n)+'(t)$')
for xii in xi[1:]:
    n += 1
    f = lambdify(t,xii,'numpy')
    plt.plot(tp, f(tp)/f(1),label='$P_'+str(n)+'(t)$')
plt.grid()
plt.legend()
plt.show()

Die ersten fünf Legendre’sche Polynome sind gegeben durch:
lp = [xii/xii.subs(t,1) for xii in xi]
for lpi in lp:
    display(lpi)
