11.1. Beispiele zur Matrix-Struktur#
Matrizen aus der FEM Diskretisierung weisen mit geeigneter Vertex Nummerierung eine Blockstruktur auf. Im Beispiel zeigen wir den Einfluss der Vertex, Edge und Element Nummerierung auf die Struktur der Matrix.
11.1.1. Strukturiertes Mesh mit kartesischer Nummerierung#
from ngsolve.meshes import MakeStructured2DMesh
from ngsolve import *
from ngsolve.webgui import Draw
import numpy as np
import scipy.sparse as sp
import matplotlib.pyplot as plt
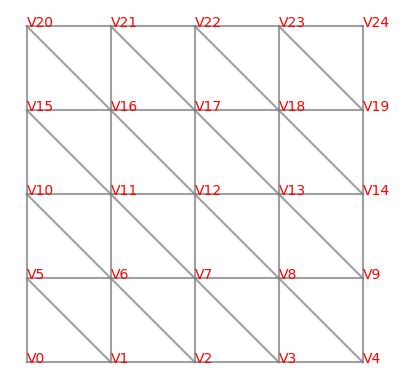
mesh = MakeStructured2DMesh(quads=False,nx=4,ny=4, mapping = lambda x,y : (x,y))
for e in mesh.edges:
    line = np.array([mesh.vertices[v.nr].point for v in e.vertices])
    plt.plot(line[:,0],line[:,1],c='gray',alpha=0.75)
for v in mesh.vertices:
    plt.text(*v.point,v,color='red')
plt.gca().set_axis_off()
plt.gca().set_aspect(1)
Wir betrachten die Matrix Struktur für die Bilinearform
\[a(u,v) = \int_\Omega \nabla u\cdot \nabla v dx\]
order = 1
V = H1(mesh, order=order, dirichlet='bottom|right|top|left')
u = V.TrialFunction()
v = V.TestFunction()

a = BilinearForm(V)
a += grad(u)*grad(v)*dx

a.Assemble()
<ngsolve.comp.BilinearForm at 0x1154c00f0>
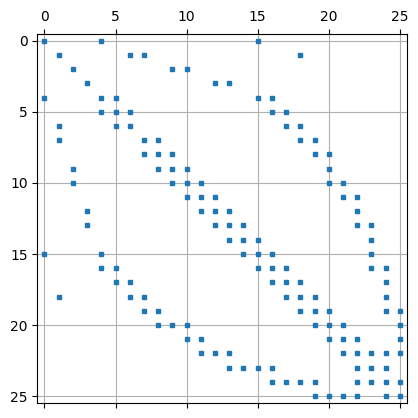
Diese Nummerierung führt zu einer schönen Blockstruktur:
rows,cols,vals = a.mat.COO()
A = sp.csr_matrix((vals,(rows,cols)))

plt.spy(A,markersize=3,)
plt.grid()
plt.show()
11.1.2. Strukturiertes Mesh hierarchischer Nummerierung (Refine)#
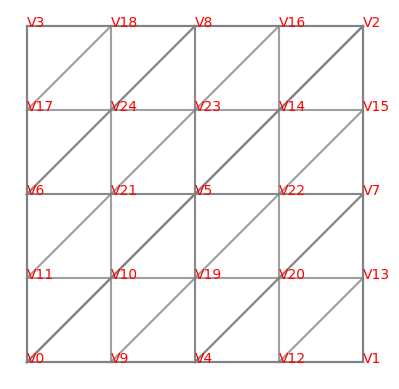
from netgen.geom2d import unit_square
ngmesh = unit_square.GenerateMesh()
for i in range(2):
    ngmesh.Refine()
mesh = Mesh(ngmesh)
for e in mesh.edges:
    line = np.array([mesh.vertices[v.nr].point for v in e.vertices])
    plt.plot(line[:,0],line[:,1],c='gray',alpha=0.75)
for v in mesh.vertices:
    plt.text(*v.point,v,color='red')
plt.gca().set_axis_off()
plt.gca().set_aspect(1)
order = 1
V = H1(mesh, order=order, dirichlet='bottom|right|top|left')
u = V.TrialFunction()
v = V.TestFunction()
a = BilinearForm(V)
a += grad(u)*grad(v)*dx
a.Assemble()
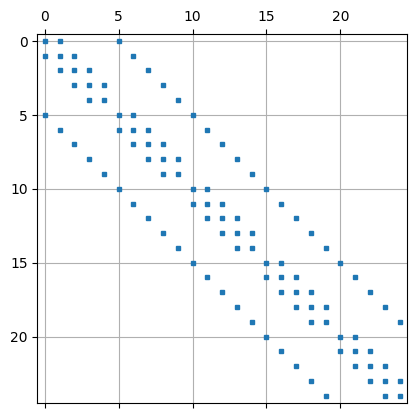
rows,cols,vals = a.mat.COO()
A = sp.csr_matrix((vals,(rows,cols)))
plt.spy(A,markersize=3,)
plt.grid()
plt.show()
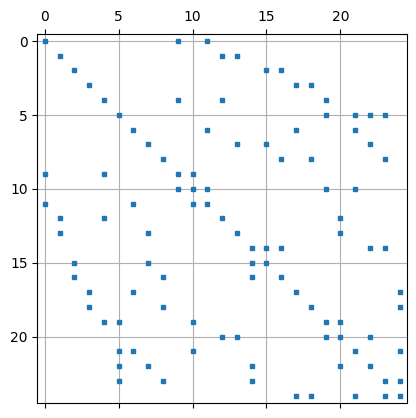
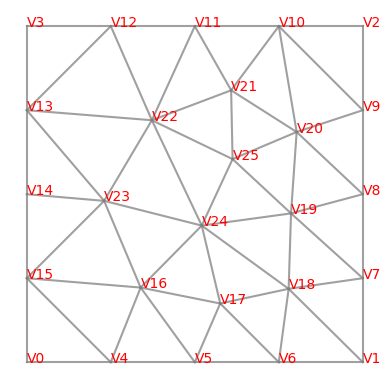
11.1.3. Unstrukturiertes Mesh#
mesh = Mesh(unit_square.GenerateMesh(maxh=0.25))
for e in mesh.edges:
    line = np.array([mesh.vertices[v.nr].point for v in e.vertices])
    plt.plot(line[:,0],line[:,1],c='gray',alpha=0.75)
for v in mesh.vertices:
    plt.text(*v.point,v,color='red')
plt.gca().set_axis_off()
plt.gca().set_aspect(1)
order = 1
V = H1(mesh, order=order, dirichlet='bottom|right|top|left')
u = V.TrialFunction()
v = V.TestFunction()

a = BilinearForm(V)
a += grad(u)*grad(v)*dx
a.Assemble()
rows,cols,vals = a.mat.COO()
A = sp.csr_matrix((vals,(rows,cols)))

plt.spy(A,markersize=3,)
plt.grid()
plt.show()