9.2.5. 1d - Beispiel zum Assembling#
Wir betrachten das Assembling für den eindimensionalen Fall anhand des Randwertproblems
Die analytische Lösung kann einfach durch zweimaliges Integrieren berechnet werden.
def uanalytic(x):
    return -0.5*x*(x-1)
Die zu betrachtende schwache Gleichung ist gegeben durch
Erste Ordnung#
Da die Bilinearform
Im Fall von finiten Elemente erster Ordnung folgt für die Diskretisierung der Bilinearform
import numpy as np
import matplotlib.pyplot as plt

# Elementsteiffigkeitsmatrix
order = 1
Ae = np.array([[1,-1],[-1,1]])

# Zerlegung des Gebiets
n=5;a=0;b=1
xi = np.linspace(a,b,n+1)
h = xi[1:]-xi[:-1]

# lokal - global mapping
N = n+1
T = np.array([[i,i+1] for i in range(N)])

# Globale Steiffigkeitsmatrix
A = np.zeros((N,N))

# Loop über Elemente (Assembling)
for i in range(n):
    # Compute Ae falls der Integrand ortsabhängig ist.
    for j in range(order+1):
        for k in range(order+1):
            A[T[i,j],T[i,k]] += Ae[j,k]/h[i]
A
array([[ 5., -5.,  0.,  0.,  0.,  0.],
       [-5., 10., -5.,  0.,  0.,  0.],
       [ 0., -5., 10., -5.,  0.,  0.],
       [ 0.,  0., -5., 10., -5.,  0.],
       [ 0.,  0.,  0., -5., 10., -5.],
       [ 0.,  0.,  0.,  0., -5.,  5.]])
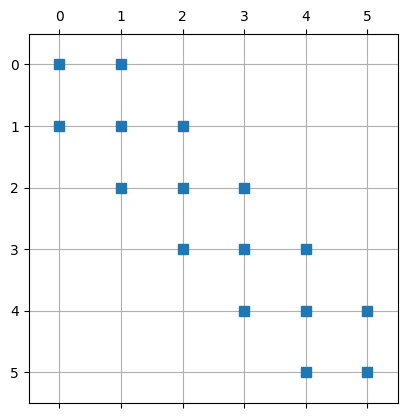
plt.spy(A,markersize=7,)
plt.grid()
plt.show()
Im allgemeinen Fall, dass die Bilinearform einen ortsabhängigen Koeffizienten hat
muss in jedem Element die Elementmatrix integriert werden. Am Beispiel der Linearform
sei das Vorgehen illustriert.
from scipy.integrate import fixed_quad
# Referenz Elementfunktionen
def phi(t,i):
    if i == 0:
        return 1-t
    else:
        return t

# Rechteseite der DGL
def func(x):
    return np.ones_like(x)

# Koordinaten Transformation
def sigma(t,i):
    return xi[i]+t*h[i]

# Globale Vektor der Linearform
f = np.zeros(N)

# Loop über Elemente (Assembling)
for i in range(n):
    # berechne lokaler Elementvektor
    fe = [np.sum([fixed_quad(lambda t: func(sigma(t,i))*phi(t,j), xi[k],xi[k+1],n=2*order)[0]
                  for k in range(n)])
          for j in range(order+1)]
    for j in range(order+1):
        f[T[i,j]] += h[i]*fe[j]
f
array([0.1, 0.2, 0.2, 0.2, 0.2, 0.1])
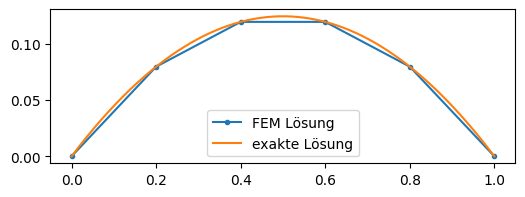
ui = np.zeros_like(xi)
ui[1:-1] = np.linalg.solve(A[1:-1,1:-1],f[1:-1])

xp = np.linspace(0,1,400)
fig, ax = plt.subplots(figsize=(6, 2))
ax.plot(xi,ui,'.-',label='FEM Lösung')
ax.plot(xp,uanalytic(xp),label='exakte Lösung')
ax.legend()
plt.show()
Zweite Ordnung Lagrange Basis Funktionen#
from sympy.abc import x as symbx
from sympy import lambdify
Betrachten wir das Vorgehen unter Verwendung von Lagrange Polynome zweiter Ordnung als Basisfunktionen.
order = 2
def lagrangePoly(x,j,order):
    xi = np.linspace(0,1,order+1)
    J = np.delete(np.arange(order+1),j)
    return np.prod([(x-xi[i])/(xi[j]-xi[i]) for i in J],axis=0)
Für die Beispielgleichung können wir die Elementmatrix wiederum vorab berechnen:
Ae = np.array([[np.sum([
    fixed_quad(lambdify(symbx,lagrangePoly(symbx,i,order).diff()*lagrangePoly(symbx,j,order).diff()),
               xi[k],xi[k+1],n=2*order)[0]
    for k in range(n)])
    for i in range(order+1)] for j in range(order+1)],dtype=float)
Ae
array([[ 2.33333333, -2.66666667,  0.33333333],
       [-2.66666667,  5.33333333, -2.66666667],
       [ 0.33333333, -2.66666667,  2.33333333]])
Die Zerlegung des Gebiets ist gegeben durch
# Zerlegung des Gebiets
n=5;a=0;b=1
xi = np.linspace(a,b,n+1)
h = xi[1:]-xi[:-1]

# lokal - global mapping
N = n+1
T = np.array([[i,i+1,i+2] for i in range(0,2*n,2)])
T
array([[ 0,  1,  2],
       [ 2,  3,  4],
       [ 4,  5,  6],
       [ 6,  7,  8],
       [ 8,  9, 10]])
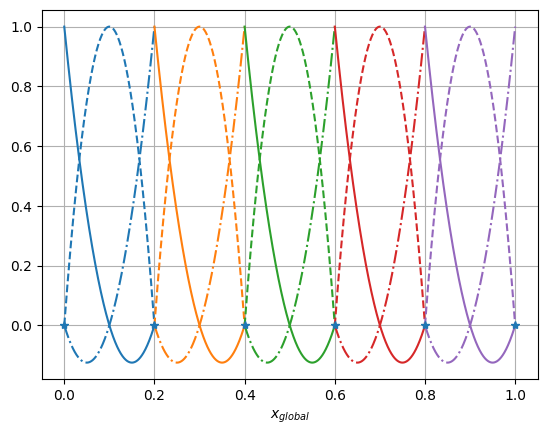
col = ['tab:blue','tab:orange','tab:green','tab:red','tab:purple']
for k in range(n):
    plt.plot(xi[k]+ h[k]*xp, lagrangePoly(xp, 0, 2),'-',c=col[k%5]) # lokale Basisfunktion 0 an globalen Kooridnaten
    plt.plot(xi[k]+ h[k]*xp, lagrangePoly(xp, 1, 2),'--',c=col[k%5])# lokale Basisfunktion 1
    plt.plot(xi[k]+ h[k]*xp, lagrangePoly(xp, 2, 2),'-.',c=col[k%5])# lokale Basisfunktion 2
plt.plot(xi,np.zeros_like(xi),'*')
plt.xlabel('$x_{global}$')
plt.grid()
plt.show()
# Globale Steiffigkeitsmatrix
A = np.zeros((2*n+1,2*n+1))

# Loop über Elemente (Assembling)
for i in range(n):
    for j in range(order+1):
        for k in range(order+1):
            A[T[i,j],T[i,k]] += Ae[j,k]/h[i]
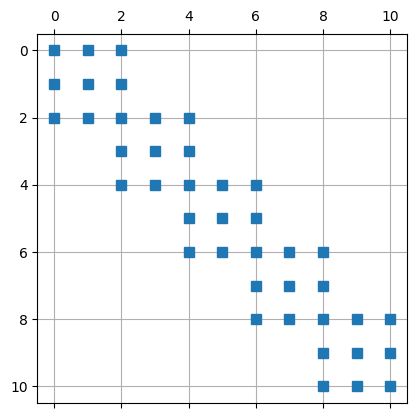
Matrix mit allen Freiheitsgrade:
plt.spy(A,markersize=7,)
plt.grid()
plt.show()
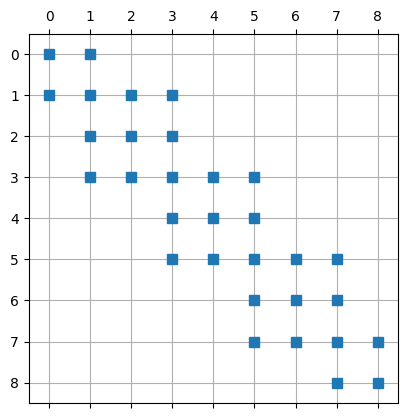
Matrix mit den freien Freiheitsgrade:
plt.spy(A[1:-1,1:-1],markersize=7,)
plt.grid()
plt.show()
Für die Linearform folgt analog:
from scipy.integrate import quad

# Rechteseite der DGL
def func(x):
    return np.ones_like(x)

# Koordinaten Transformation
def sigma(t,i):
    return xi[i]+t*h[i]

def invsigma(x,i):
    return (x-xi[i])/h[i]

# Globale Vektor der Linearform
f = np.zeros(2*n+1)

# Loop über Elemente (Assembling)
for i in range(n):
    # berechne lokaler Vektor
    fe = [np.sum([fixed_quad(lambda t: func(sigma(t,i))*lagrangePoly(t,j,order), xi[k],xi[k+1],n=2*order)[0]
                  for k in range(n)])
          for j in range(order+1)]
    for j in range(order+1):
        f[T[i,j]] += h[i]*fe[j]
f
array([0.03333333, 0.13333333, 0.06666667, 0.13333333, 0.06666667,
       0.13333333, 0.06666667, 0.13333333, 0.06666667, 0.13333333,
       0.03333333])
und damit die Lösung
ui = np.zeros(2*n+1)
ui[1:-1] = np.linalg.solve(A[1:-1,1:-1],f[1:-1])
ui
array([0.   , 0.045, 0.08 , 0.105, 0.12 , 0.125, 0.12 , 0.105, 0.08 ,
       0.045, 0.   ])
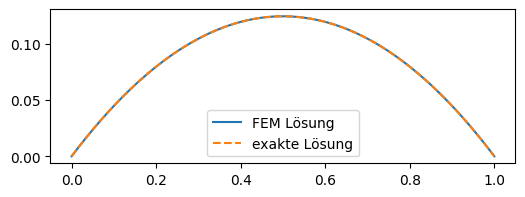
Um die Lösung präzise darstellen zu können, muss die Visualisierung angepasst werden. Wir benutzen nicht mehr die stückweise lineare Interpolation der plt.plot Funktion. Die Lösung ist gegeben als Linearkombination der globalen Basisfunktionen. Diese können wir mit Hilfe der drei lokalen Basisfunktionen darstellen:
def visu(x,ui):
    res = np.zeros_like(x)
    for i in range(n):
        if i < n-1:
            ind = (xi[i]<=x)*(x<xi[i+1])
        else:
            ind = (xi[i]<=x)*(x<=xi[i+1])
        for j in range(order+1):
            res[ind] += ui[T[i,j]]*lagrangePoly(invsigma(x[ind],i),j,order)
    return res
xp = np.linspace(0,1,400)
fig, ax = plt.subplots(figsize=(6, 2))
ax.plot(xp,visu(xp,ui),'-',label='FEM Lösung')
ax.plot(xp,uanalytic(xp),'--',label='exakte Lösung')
ax.legend()
plt.show()
xp = np.linspace(0,1,400)
fig, ax = plt.subplots(figsize=(6, 2))
ax.plot(xp,visu(xp,ui)-uanalytic(xp),'-')
plt.show()
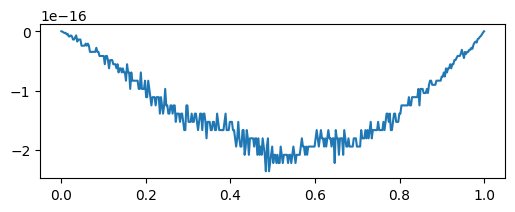
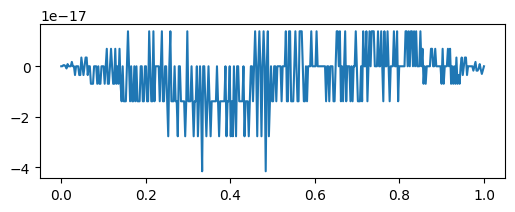
Die analytische Lösung ist ein quadratisches Polynom, weshalb die numerische Lösung auch exakt ist.
Zweite Ordnung hierarchische Basis Funktionen#
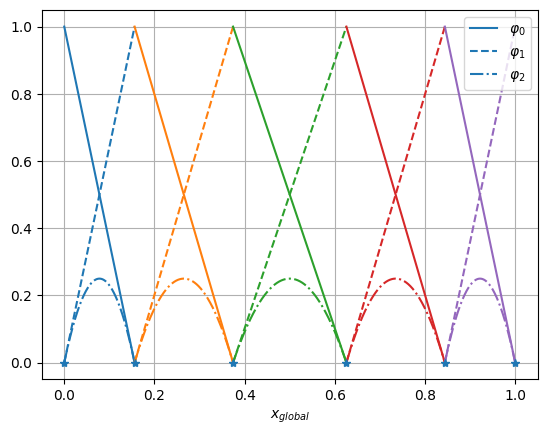
Anstelle von drei Lagrange Polyome können wir auch den Ansatz, wie in ngsolve verwendet, anwenden. Die Basisfunktionen bauen rekursive auf den Basisfunktionen niedriger Ordnung auf. Daher haben wir für order=2 die drei lokalen Basisfunktionen
from sympy.abc import x as symbx
from sympy import lambdify
order = 2
def myshape(x,j):
    if j == 0:
        return 1-x
    elif j == 1:
        return x
    else:
        return x*(1-x)
Als Zerlegung für das Gebiet nutzen wir nicht äquidistante Intervalle.
# Zerlegung des Gebiets
n=5;a=0;b=1
xi = a+(b-a)*(np.arctan(np.linspace(-1,1,n+1))-np.arctan(-1))/(2*np.arctan(1))
h = xi[1:]-xi[:-1]
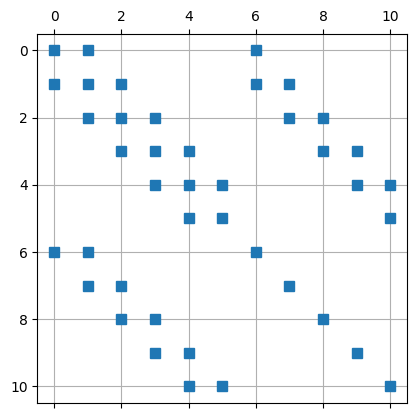
Das lokal - global Mapping ist nun leicht unterschiedlich. Globale Basisfunktionen setzen sich aus den beiden ersten Basisfunktionen zusammen. Entsprechend gilt:
# lokal - global mapping
N = n+1
T = np.array([[i,i+1,n+1+i] for i in range(0,n)])
T
array([[ 0,  1,  6],
       [ 1,  2,  7],
       [ 2,  3,  8],
       [ 3,  4,  9],
       [ 4,  5, 10]])
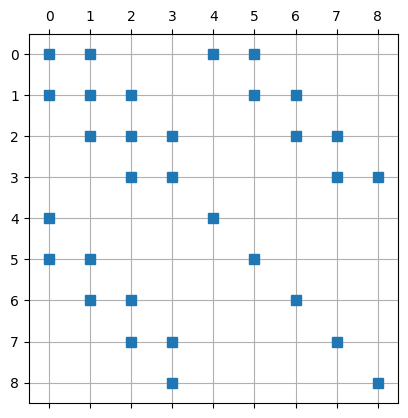
Die freien Freiheitsgrade sind in dem Fall gegeben durch
freedofs = np.ones(np.max(T)+1,dtype=bool)
freedofs[0] = False # ohne Punkt 0 (linke Gebietsgrenze)
freedofs[5] = False # ohne Punkt 6 (rechte Gebietsgrenze)
freedofs
array([False,  True,  True,  True,  True, False,  True,  True,  True,
        True,  True])
Für die Intervall Längen gilt:
h
array([0.15595826, 0.21837582, 0.25133183, 0.21837582, 0.15595826])
col = ['tab:blue','tab:orange','tab:green','tab:red','tab:purple']
for k in range(n):
    plt.plot(xi[k]+ h[k]*xp, myshape(xp, 0),'-',c=col[k%5]) # lokale Basisfunktion 0 an globalen Kooridnaten
    plt.plot(xi[k]+ h[k]*xp, myshape(xp, 1),'--',c=col[k%5])# lokale Basisfunktion 1
    plt.plot(xi[k]+ h[k]*xp, myshape(xp, 2),'-.',c=col[k%5])# lokale Basisfunktion 2
plt.legend([r'$\varphi_0$',r'$\varphi_1$',r'$\varphi_2$'],loc=1)
plt.plot(xi,np.zeros_like(xi),'*')
plt.xlabel('$x_{global}$')
plt.grid()
plt.show()
Ae = np.array([[np.sum([fixed_quad(lambdify(symbx,myshape(symbx,i).diff()*myshape(symbx,j).diff()),
                                    xi[k],xi[k+1],n=2*order)[0]
                        for k in range(n)])
                for i in range(order+1)] for j in range(order+1)],dtype=float)
Für die Elementsteifigkeitsmatrix folgt
np.round(Ae,4)
array([[ 1.    , -1.    ,  0.    ],
       [-1.    ,  1.    , -0.    ],
       [ 0.    , -0.    ,  0.3333]])
mit obiger Zerlegung:
# Globale Steiffigkeitsmatrix
A = np.zeros((2*n+1,2*n+1))

# Loop über Elemente (Assembling)
for i in range(n):
    for j in range(order+1):
        for k in range(order+1):
            A[T[i,j],T[i,k]] += Ae[j,k]/h[i]
Matrix mit allen Freiheitsgrade:
plt.spy(A,markersize=7,)
plt.grid()
plt.show()
Matrix mit den freien Freiheitsgrade:
plt.spy(A[np.ix_(freedofs,freedofs)],markersize=7,)
plt.grid()
plt.show()
# Rechteseite der DGL
def func(x):
    return np.ones_like(x)

# Koordinaten Transformation
def sigma(t,i):
    return xi[i]+t*h[i]

def invsigma(x,i):
    return (x-xi[i])/h[i]

# Globale Vektor der Linearform
f = np.zeros(2*n+1)

# Loop über Elemente (Assembling)
for i in range(n):
    # berechne lokaler Vektor
    fe = np.array([np.sum([fixed_quad(lambda t: func(sigma(t,i))*myshape(t,j), xi[k],xi[k+1],n=2*order)[0]
                           for k in range(n)])
                   for j in range(order+1)])
    #for j in range(order+1):
    f[T[i]] += h[i]*fe
f
array([0.07797913, 0.18716704, 0.23485383, 0.23485383, 0.18716704,
       0.07797913, 0.02599304, 0.03639597, 0.04188864, 0.03639597,
       0.02599304])
Lösung des linearen Gleichungssystems für die freien Freiheitsgrade
ui = np.zeros(2*n+1)
ui[freedofs] = np.linalg.solve(A[np.ix_(freedofs,freedofs)],f[freedofs])
ui
array([0.        , 0.06581764, 0.11710404, 0.11710404, 0.06581764,
       0.        , 0.01216149, 0.023844  , 0.03158385, 0.023844  ,
       0.01216149])
def visu(x,ui):
    res = np.zeros_like(x)
    for i in range(n):
        if i < n-1:
            ind = (xi[i]<=x)*(x<xi[i+1])
        else:
            ind = (xi[i]<=x)*(x<=xi[i+1])
        for j in range(order+1):
            # neue lokale Basis
            res[ind] += ui[T[i,j]]*myshape(invsigma(x[ind],i),j)
    return res
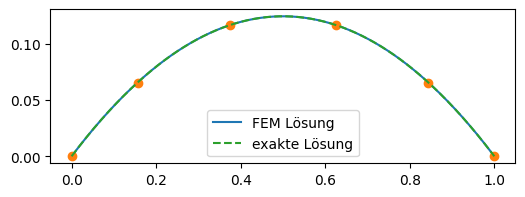
xp = np.linspace(0,1,400)
fig, ax = plt.subplots(figsize=(6, 2))
ax.plot(xp,visu(xp,ui),'-',label='FEM Lösung')
ax.plot(xi,visu(xi,ui),'o')
ax.plot(xp,uanalytic(xp),'--',label='exakte Lösung')
ax.legend()
plt.show()
xp = np.linspace(0,1,400)
fig, ax = plt.subplots(figsize=(6, 2))
ax.plot(xp,visu(xp,ui)-uanalytic(xp),'-')
plt.show()
